Table of Contents
Literacy Assignment 8: Ride Hailing
Data source: NY Times Article
Objective:
To think creatively and critically about data visualization decisions and motivation. Additionally, to use visualizations and data to spark further research and questions.
Deliverable:
1 one-page PDF (no MSWORD, please!) writeup that responds to the questions below.
Grading standards:
Your PDF will be graded on the following:
- 100% Successfully turned in a PDF with reasonable answers. Help us know that you're thinking critically about the data!
Assignment Description:
For this assignment, you will need to analyze the following graph and respond to the questions/prompts below. Please submit your responses as a one-page PDF via LearningSuite.
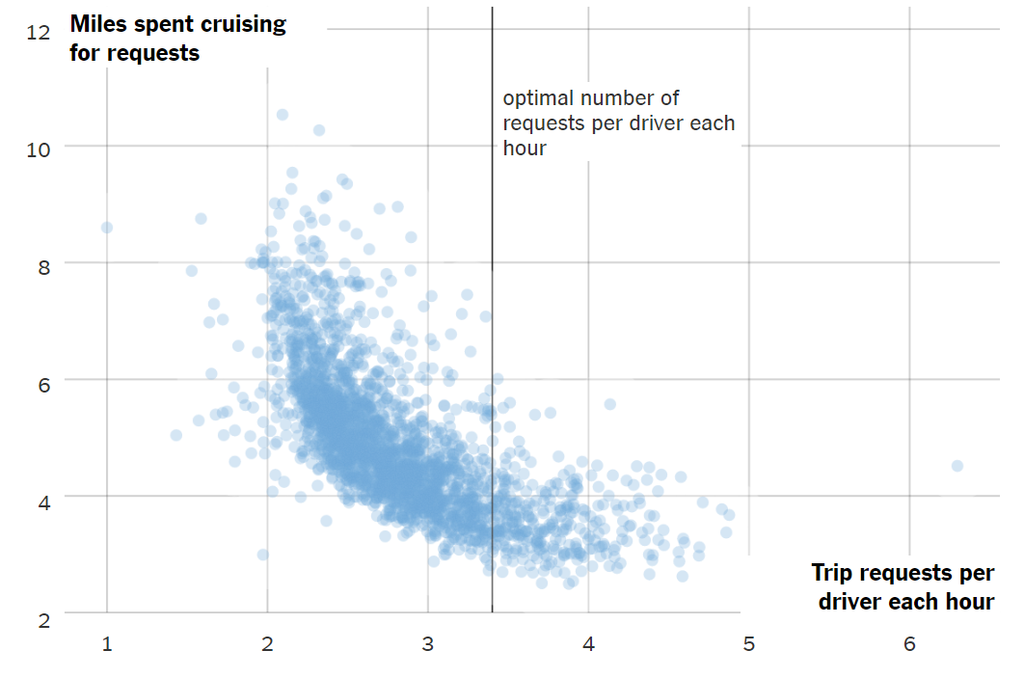
You must respond to the following questions.
This graphic was published in a NY Times article.
- What do you first notice about this graph?
- What information in this graph is most interesting to you, and why?
- What does this graph say about how drivers use their time?
- What would you change about this graph?
- What intrigues you most after studying this graph?
- List three (3) additional research questions you could pursue with the data used to make this graph.