cs401r_w2016:lab4
This is an old revision of the document!
Table of Contents
Objective:
To understand Gaussian process regression, and to be able to generate nonparametric regressions with confidence intervals. Also to understand the interplay between a kernel (or covariance) function, and the resulting confidence intervals of the regression.
Deliverable:
You will turn in an iPython notebook that performs Gaussian process regression on a simple dataset. You will explore multiple kernels and vary their parameter settings.
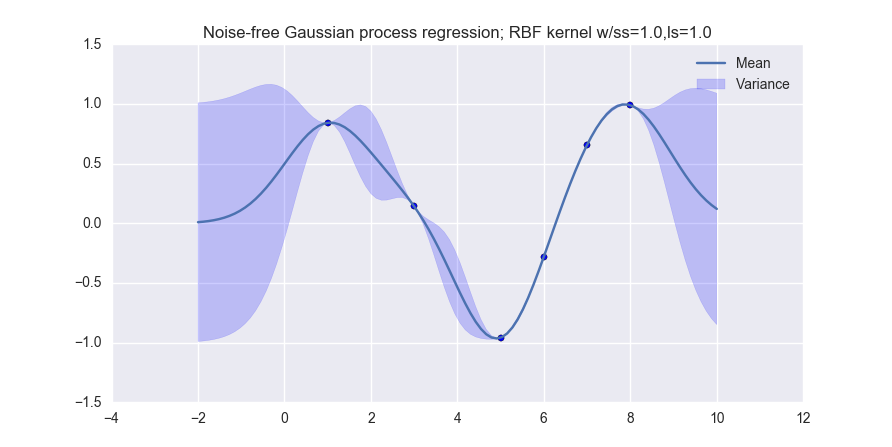
When you are done, you should produce visualizations like the following (for noiseless observations):
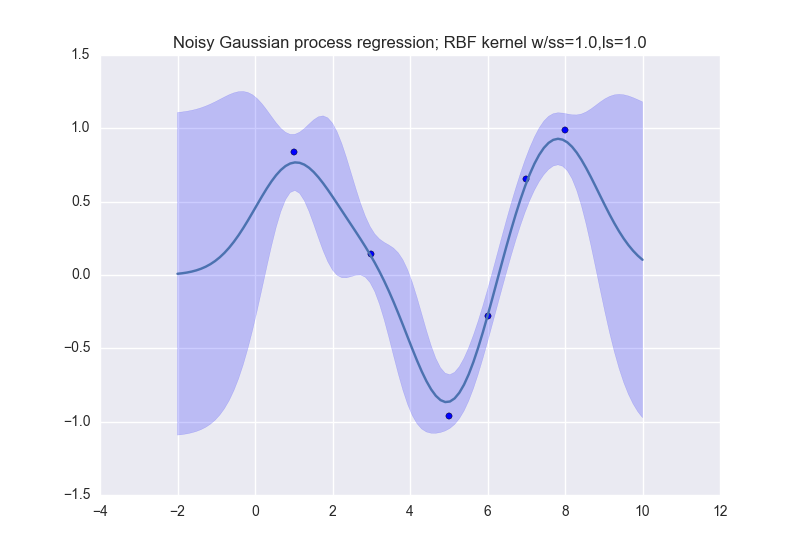
and like this (for noisy observations):
Description:
data_xvals = numpy.atleast_2d( [ 1.0, 3.0, 5.0, 6.0, 7.0, 8.0 ] )
data_yvals = numpy.sin( data_xvals )
Hints:
The following functions may be useful to you:
plt.gca().fill_between
plt.scatter

numpy.linalg.inv
cs401r_w2016/lab4.1450913525.txt.gz · Last modified: 2021/06/30 23:40 (external edit)
Except where otherwise noted, content on this wiki is licensed under the following license: CC Attribution-Share Alike 4.0 International
