Table of Contents
Objective:
To explore deeper networks, to leverage convolutions, and to explore Tensorboard.
Deliverable:
For this lab, you will need to perform three steps:
- You need to implement the Deep MNIST for experts tutorial
- You need to modify the tutorial code to deliver visualizations via Tensorboard.
Specifically, you should turn in an iPython notebook that shows two images:
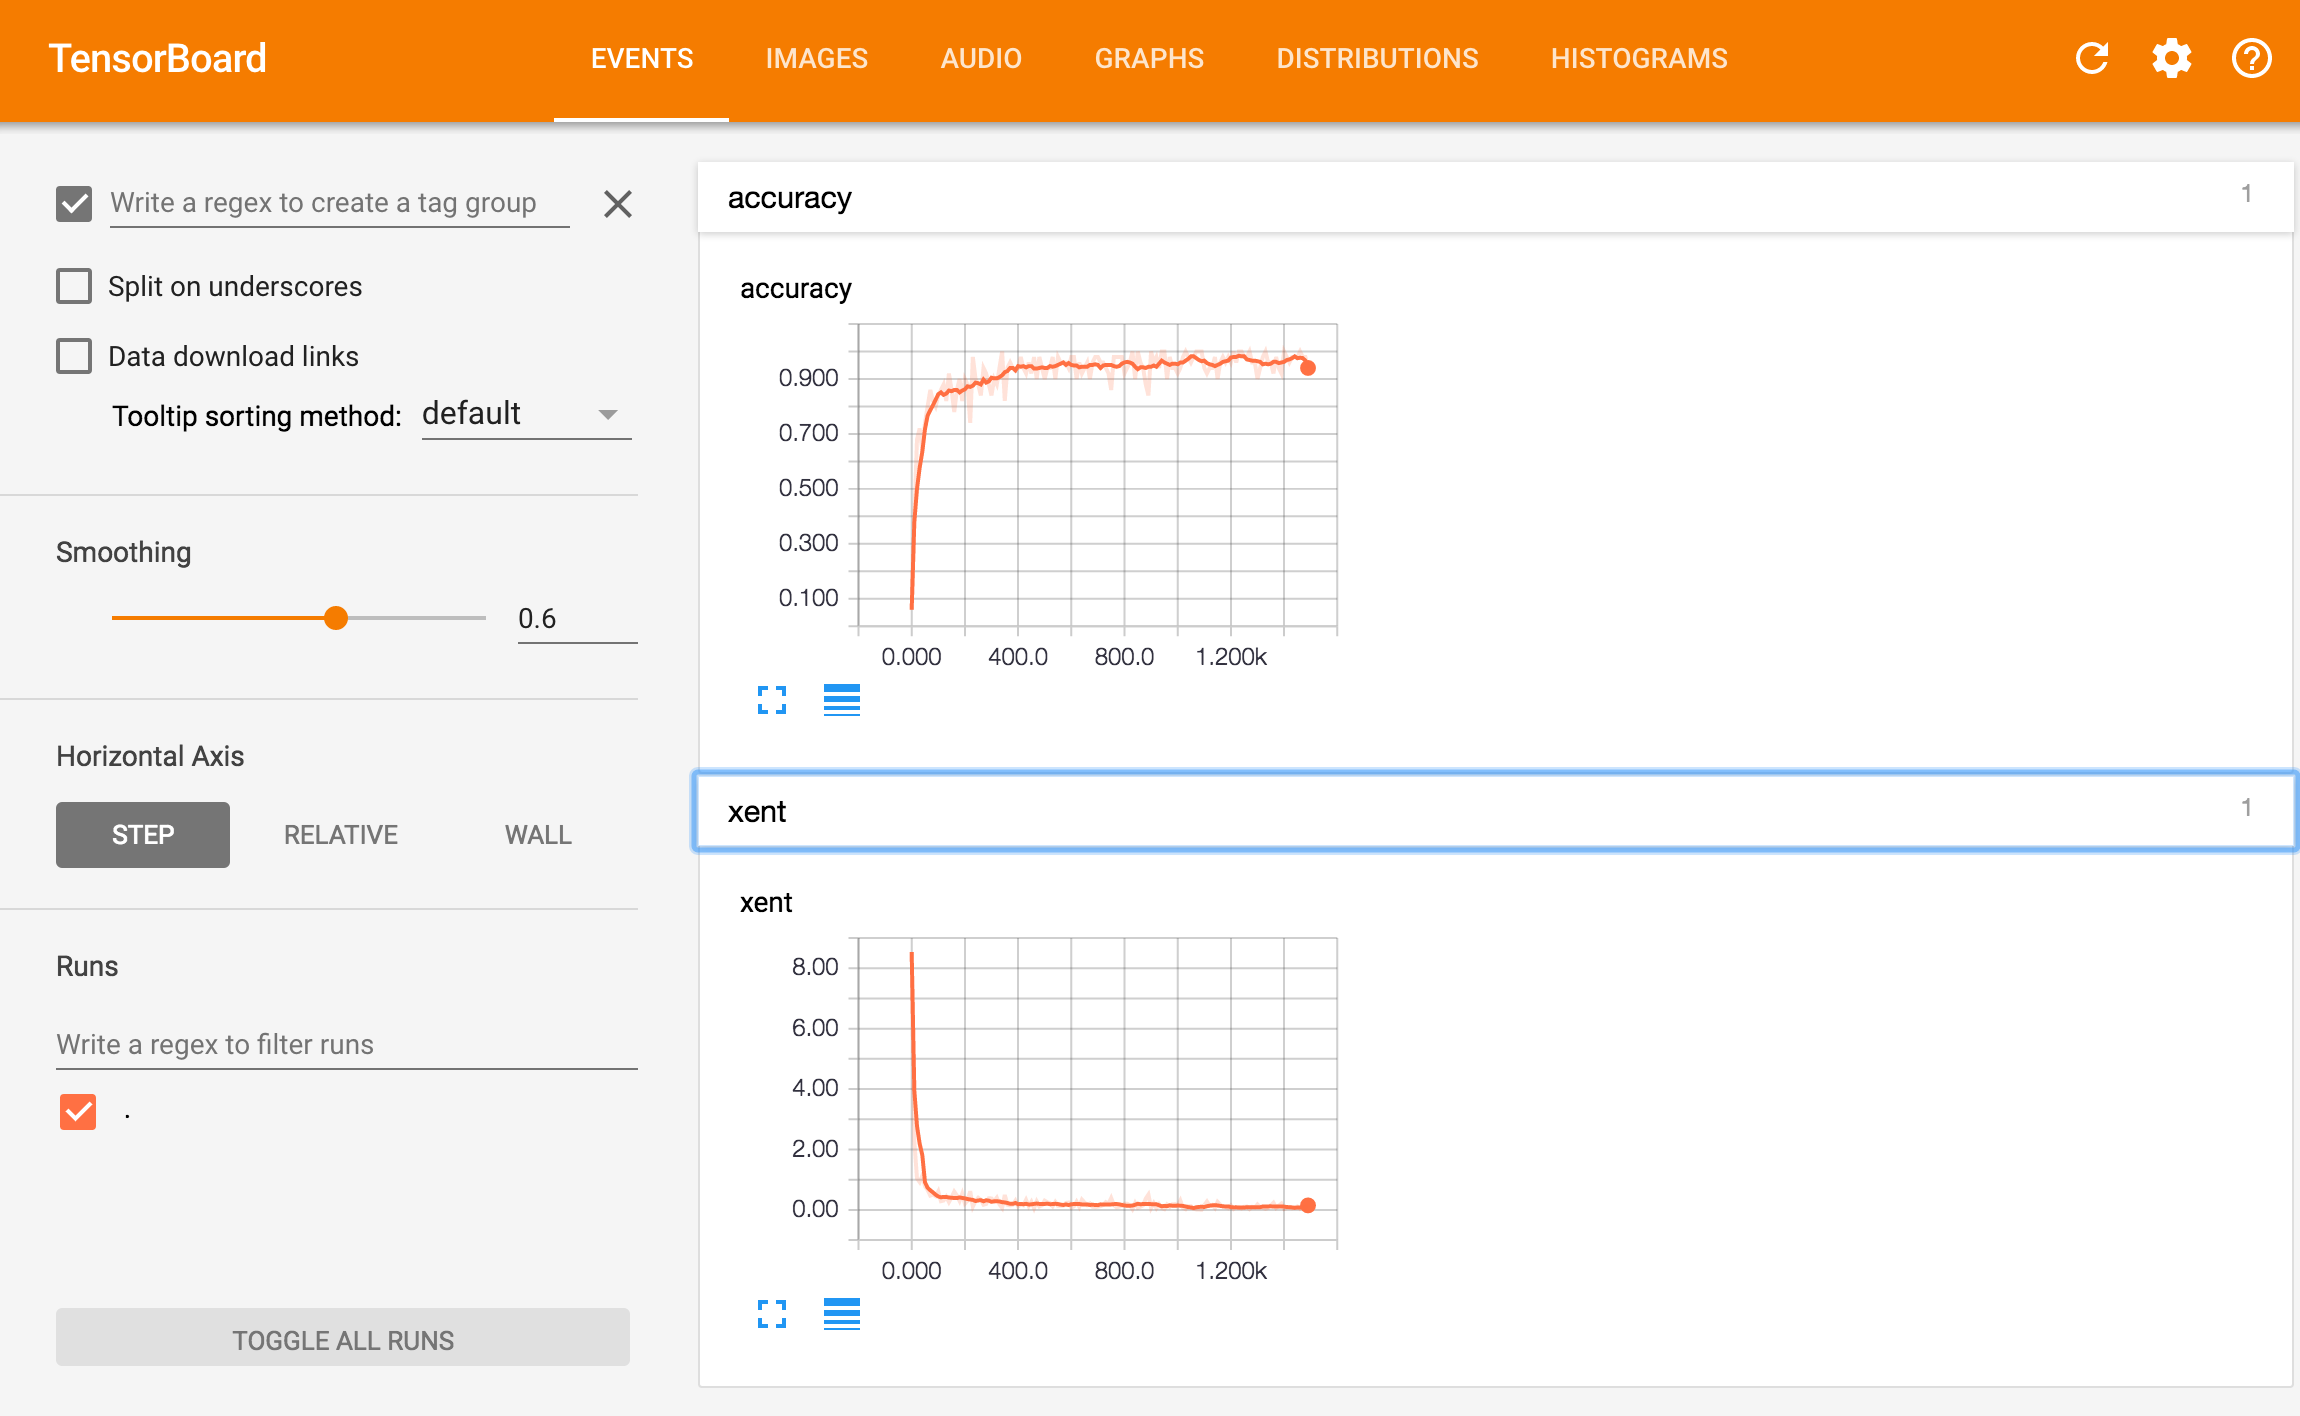
- A Tensorboard image showing your cost function and classification accuracy over time (using the training set accuracy is fine)
- A Tensorboard image showing your (expanded) computation graph
An example of the cost function / classification accuracies are shown at the right. An example of the expanded computation graph is shown down below. (Note the “Download PNG” button in the upper-left of Tensorboard!)
According to the tutorial, if you run for 20,000 iterations, the final accuracy of your classifier will be around 99.5%. To make your life simpler, you only need to run for 1500 iterations. My final accuracy was 97.1%
Note for the welfare of your souls: while the majority of the code for this lab is cut-and-paste, please take a moment to understand all of the layers that we're creating, what they're doing, and how they connect together!
Grading standards:
Your notebook will be graded on the following:
- 40% Correct multilayer convolutional network defined and working
- 30% Tidy and legible display of Tensorboard accuracy / cost function
- 30% Tidy and legible display of Tensorboard computation graph
Description:
You now understand the basics of multi-layer neural networks. Here, we'll expand on your toolkit by adding in convolutions, a bit of dropout, and a new optimization method. Most of these will be explained in future lectures, so for now we will just use them without (fully) understanding them.
Part 1: implement deep convolutional networks
For this lab, you must implement the Deep MNIST for experts tutorial. This is mostly cutting-and-pasting code; since you already have Tensorflow up and running, this should be fairly straightfoward.
A few things to note:
- You are now adding multiple layers. Be careful with your variable names!
- You'll use the Adam optimizer, not vanilla SGD. We learn more about this later.
- The dropout layer is optional, but you should probably leave it in just to make cutting-and-pasting easier.
Note: you only need to train for 1500 steps. My final accuracy was 97.1%, although it varied from run to run. If you want to train for the full 20k steps, you are of course welcome to do so!
Part 2: add in Tensorboard visualizations
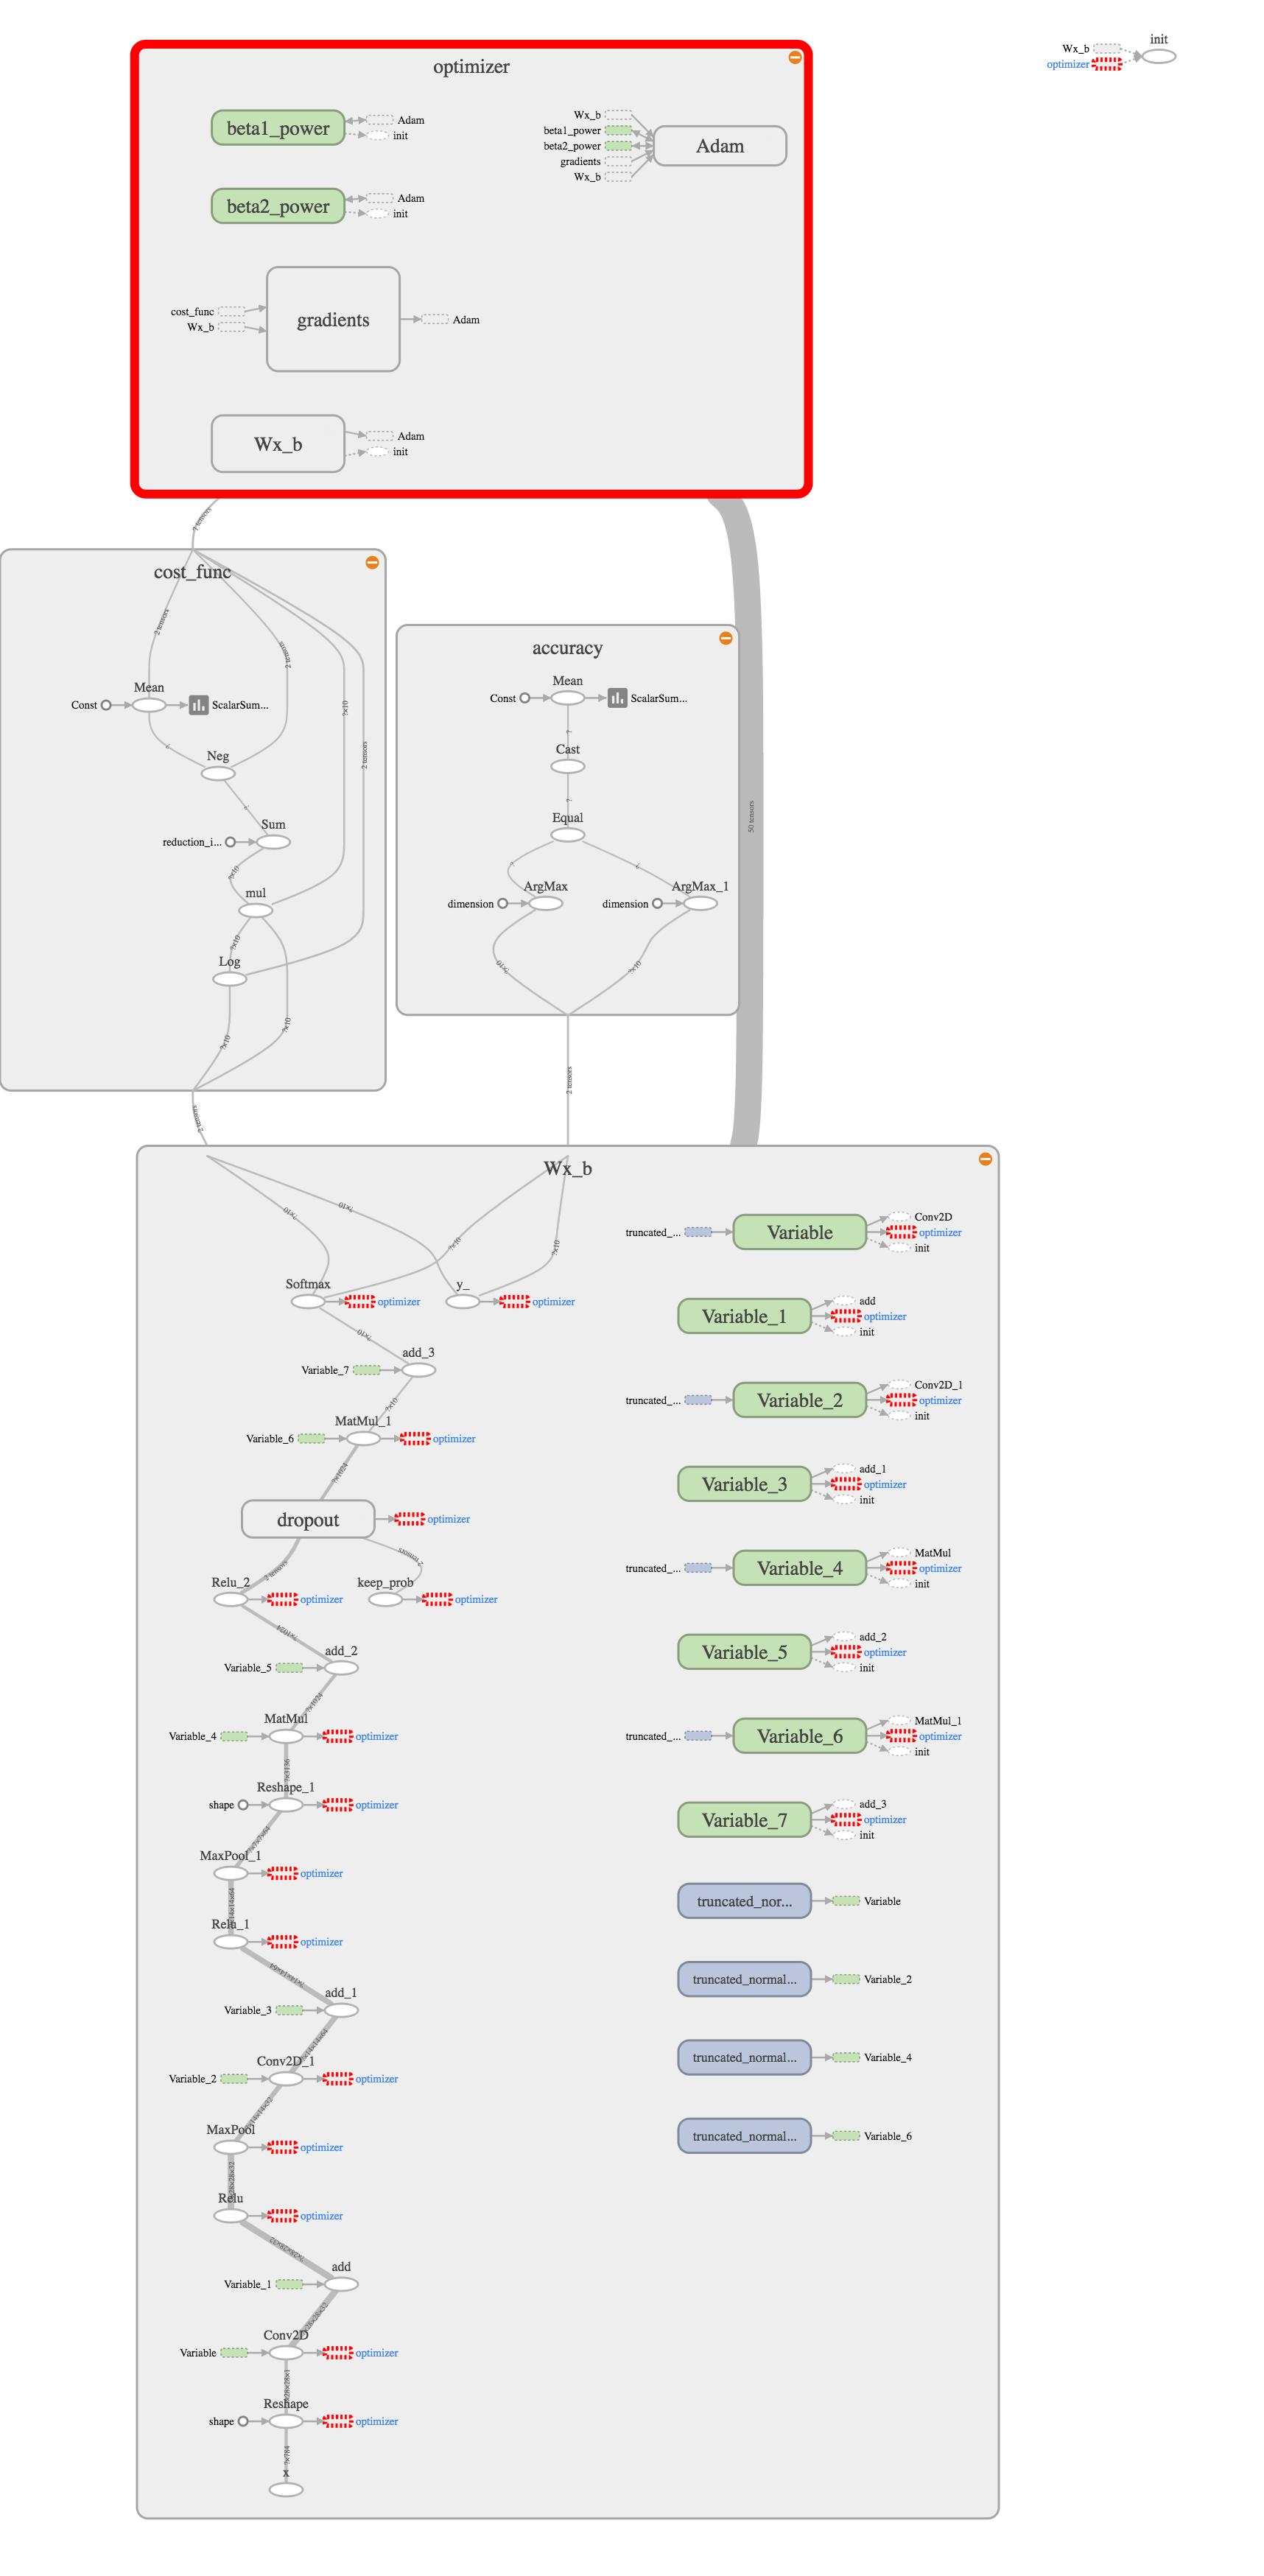
There are two parts to this: first, you need to scope all of the nodes in your computation graph. In class, I showed a visualization that drew pretty boxes around all of the different parts of your computation graph. That's what I want from you! Check out the tf.name_scope function. You should create 4 scopes: “Wx_B” for your computation graph, “Cost” for your cost function, “accuracy” for your accuracy calculations, and “optimizer” for your optimizer. When you're done, you should have something that looks like the graph on the right.
Second, you'll need to produce little graphs that show accuracy over time. You should record your accuracy every 10 iterations.
This is done by asking Tensorflow to create summaries of key variables. Adventurous souls can dive right into the Tensorflow visualization tutorial. Here are some condensed notes:
Tensorboard logs events to a summary log. You'll need to tell Tensorboard where to stash those events and when to write them out; both are done with a SummaryWriter. You need to create a SummaryWriter object:
summary_writer = tf.train.SummaryWriter( “./tf_logs”, graph=sess.graph )
as well as scalar summaries of relevant variables; maybe something like this:
acc_summary = tf.scalar_summary( 'accuracy', accuracy )
These summaries are considered ops, just like any node in the computation graph, and they are triggered by sess.run. Tensorflow helpfully allows you to merge all of the summary ops into a single operation:
merged_summary_op = tf.merge_all_summaries()
Then, you'll need to trigger the merged_summary_op operation. This will generate a summary string, which you should pass to your summary writer.
Once you have run your code and collected the necessary statistics, you should be able to start up the Tensorboard visualizer. It runs as a webserver; to start Tensorboard, you should be able to run something like the following from the directory where you ran your TF code:
cd tf_logs
tensorboard --logdir .
At which point you'll see something like the following output:
Starting TensorBoard 28 on port 6006
(You can navigate to http://192.168.250.107:6006)
Point your browser to the spot indicated, and voila!
Hints:
Make sure you close your SummaryWriter object at the end of your script, or else your accuracy / cross entropy graphs may not show up!
Tensorboard seems a little finnicky. I have found that I sometimes need to stop it and restart it to avoid having multiple graphs overlap, even if I remove the log files.
