cs180_lab2
Table of Contents
Literacy Lab 2: Tweet Sentiment:
Now that 2020 is behind us, we can all breathe a collective sigh of relief and start sciencing it.
Objective:
To begin to think creatively and critically about data visualizations and analysis.
Deliverable:
1 one-page PDF (no MSWORD, please!) writeup that responds to the questions below.
Grading standards:
Your PDF will be graded on the following:
- 100% Successfully turned in a PDF with reasonable answers
Lab Description:
For this assignment, you will need to analyze the following infographic, and respond to the questions below. Please submit your responses as a one-page PDF via LearningSuite.
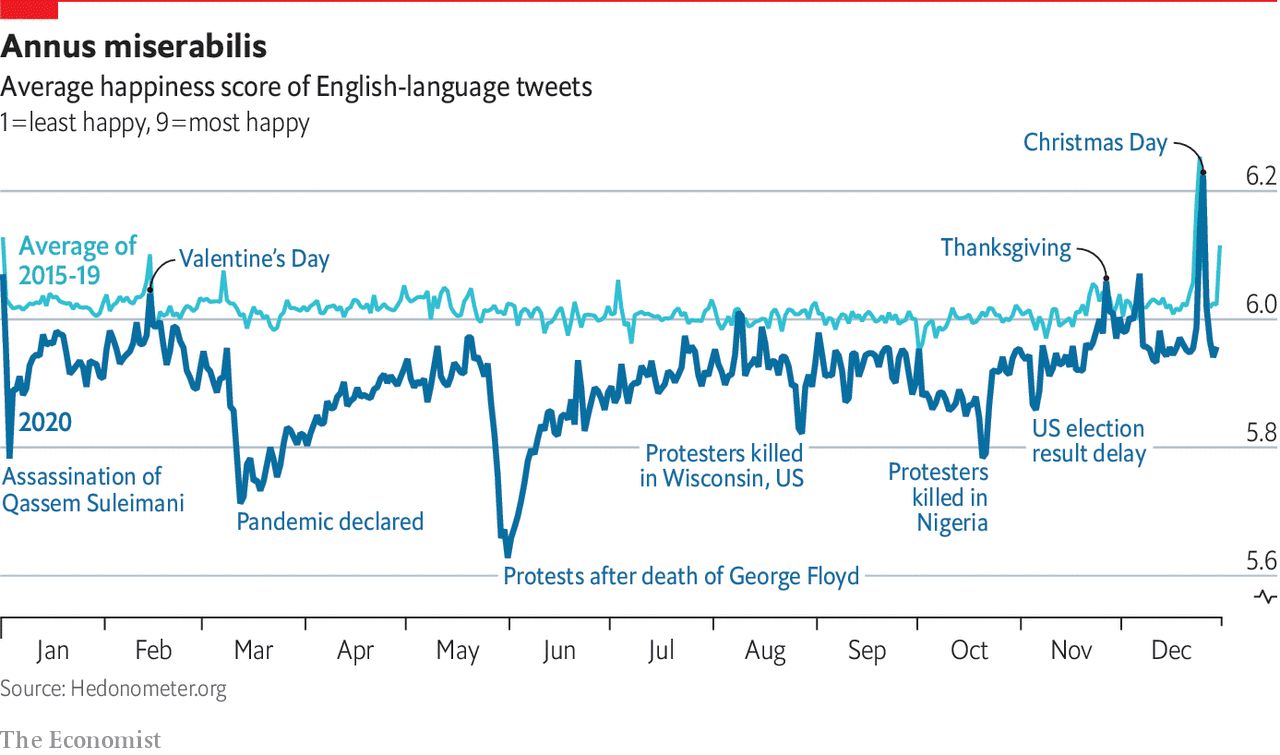
You must respond to the following questions.
This infographic was published in an Economist article. It relies on a technique called sentiment analysis.
- What can you conclude from this data?
- What can't you conclude from this data?
- What are the limitations of possible conclusions based on the way the data was collected?
- Does this data tell us anything about how to make the world a better place?
cs180_lab2.txt · Last modified: 2021/06/30 23:42 (external edit)
Except where otherwise noted, content on this wiki is licensed under the following license: CC Attribution-Share Alike 4.0 International
