Table of Contents
Objective:
To gain experience with python, numpy, and linear classification.
Oh, and to remember all of that linear algebra stuff. ;)
Deliverable:
You should turn in an iPython notebook that implements the perceptron algorithm on two different datasets: the Iris dataset, and the CIFAR-10 dataset. Because the perceptron is a binary classifier, we will preprocess the data and “squash” it to create two classes.
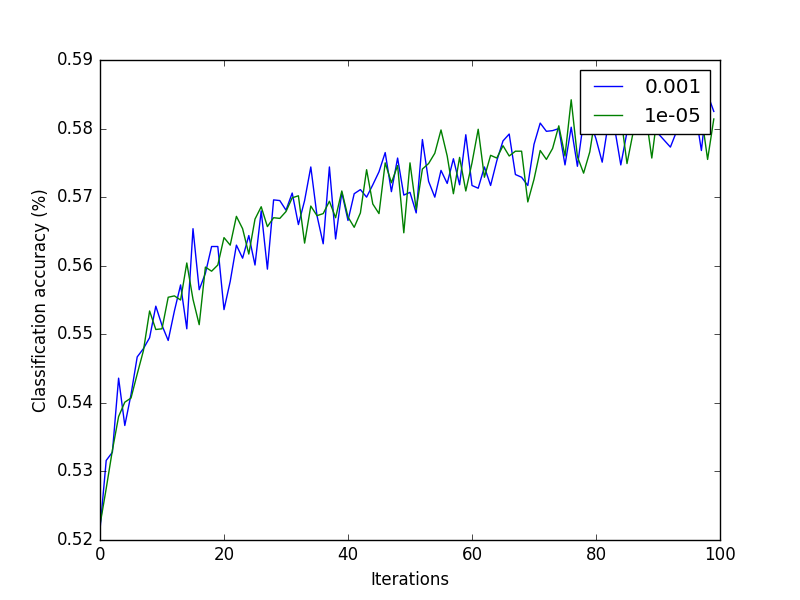
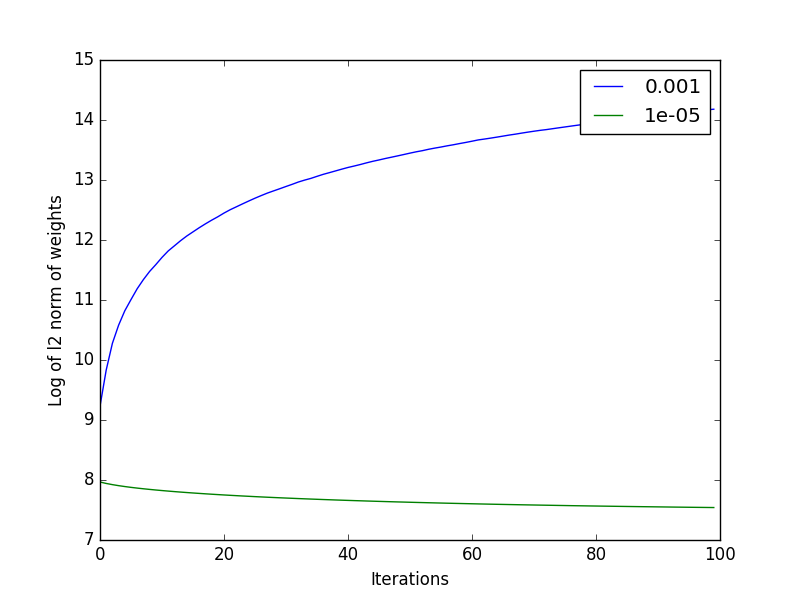
Your notebook should also generate a visualization that shows classification accuracy at each iteration, along with the log of the l2 norm of the weight vector, for two different values of the perceptron's step size. Examples of both are shown at the right (for the CIFAR-10 dataset). Since there are two datasets, and there are two visualizations per dataset, your notebook should produce a total of 4 plots.
Please cleanly label your axes!
The Iris dataset can be downloaded at the UCI ML repository, or you can download a slightly simpler version here: http://liftothers.org/Fisher.csv
The CIFAR-10 dataset can be downloaded at https://www.cs.toronto.edu/~kriz/cifar.html
Note: make sure to download the python version of the data - it will simplify your life!
Grading standards:
Your notebook will be graded on the following:
- 70% Correct implementation of perceptron algorithm
- 20% Tidy and legible visualization of weight norm
- 10% Tidy and legible plot of classification accuracy over time
Description:
The purpose of this lab is to help you become familiar with numpy, to remember the basics of classification, and to implement the perceptron algorithm. The perceptron algorithm is a simple method of learning a separating hyperplane. It is guaranteed to converge iff the dataset is linearly separable - otherwise, you have to cross your fingers!
You should implement the perceptron algorithm according to the description in Wikipedia:
As you implement this lab, you will (hopefully!) learn the difference between numpy's matrices, numpy's vectors, and lists. In particular, note that a list is not the same a vector, and a n x 1 matrix is not the same as a vector of length n.
You may find the functions np.asmatrix, np.atleast_2d, and np.reshape helpful to convert between them.
Also, you may find the function np.dot helpful to compute matrix-vector products, or vector-vector products. You can transpose a matrix or a vector by calling the .T method.
Hint: you should start with the Iris dataset, then once you have your perceptron working, you should move to the CIFAR-10 dataset.
Preparing the data:
Both datasets are natively multiclass, but we need to convert them to binary classification problems. To show you how we're going to do this, and to give you a bit of code to get started, here is how I loaded and converted the Iris dataset:
data = pandas.read_csv( 'Fisher.csv' )
m = data.as_matrix()
labels = m[:,0]
labels[ labels==2 ] = 1  # squash class 2 into class 1
labels = np.atleast_2d( labels ).T
features = m[:,1:5]
and the CIFAR-10 dataset:
def unpickle( file ):
    import cPickle
    fo = open(file, 'rb')
    dict = cPickle.load(fo)
    fo.close()
    return dict

data = unpickle( 'cifar-10-batches-py/data_batch_1' )

features = data['data']
labels = data['labels']
labels = np.atleast_2d( labels ).T

# squash classes 0-4 into class 0, and squash classes 5-9 into class 1
labels[ labels < 5 ] = 0
labels[ labels >= 5 ] = 1
Running the perceptron algorithm
Remember that if a data instance is classified correctly, there is no change in the weight vector.
In the wikipedia description of the perceptron algorithm, notice the function f. That's the Heaviside step function. What does it do?
You should run the perceptron for at least 100 steps. Note that your perceptron will probably converge in much fewer on the Iris dataset!
You should also test different step sizes. Wikipedia doesn't discuss how to do this, but it should be straightforward for you to figure out; the algorithm description in the lecture notes includes the step size. (But try to figure it out: consider the update equation for a weight, and ask yourself: where should I put a stepsize parameter, to be able to adjust the magnitude of the weight update?)
For the Iris dataset, you should test at least c=1, c=0.1, c=0.01.
For the CIFAR-10 dataset, you should test at least c=0.001, c=0.00001.
Computing the l2 norm of the weight vector
It is interesting to watch the weight vector as the algorithm progresses.
This should only take a single line of code. Hint: can you rewrite the l2 norm in terms of dot products?
Plotting results
You may use any notebook compatible plotting function you like, but I recommend matplotlib. This is commonly imported as
import matplotlib.pyplot as plt
To create a new figure, call plt.figure. To plot a line, call plt.plot. Note that if you pass a matrix into plt.plot, it will plot multiple lines at once, each with a different color; each column will generate a new line.
Note that if you use matplotlib, you may have to call plt.show to actually construct and display the plot.
Don't forget to label your axes!
You may find this tutorial on pyplot helpful.
Hints:
An easy way to load a CSV datafile is with the pandas package.
Here are some functions that may be helpful to you:
np.random.randn

import matplotlib.pyplot as plt

plt.figure
plt.plot
plt.xlabel
plt.ylabel
plt.legend
plt.show
